
Since I am interested in the topic of Insoric RealPower or measuring the power under real conditions conditions for a long time and in the last 1-2 years I have heard a lot of positive I have heard a lot of positive things from different tuners, I thought it was time to look into it and see if I could use it and see if I can get a real advantage for my work and for my clients. benefit from it. I have now spent a lot of time with the system on on the road on different cars and wanted to share my impressions of the system. of the system.
What Insoric advertises:
- High-precision, innovative sensor technology: the Insoric RealPower measuring module
- Measuring process takes place without complex wiring and completely without an electronic interface
- Simple and fast data evaluation on the PC
- Flexible in use: practically anywhere and at any time Measurements can be carried out
- Measurement takes place in the actual vehicle environment, i.e. during the measurement drive on a road. measurement drive on a road
- Made in Switzerland: Development, production and distribution take place in and from Switzerland
- Independent test system; works independently of other test systems. test systems
- Also for all-wheel drive vehicles
- Conclusion: highly reliable, precise, comprehensible and comparable comparable measurements, based on actual conditions.
Insoric RealPower is a real innovation. The development was The development was significantly accompanied by a technical university in Switzerland.

And what is it really?
What is different in this solution or what should make this make this solution significantly better than existing low-budget solutions such as Racelogic PerformanceBox, Gtech PRO, log evaluations with programs like like Virtual Dyno, smartphone apps like PerfExpert or Dynolicious?
(IMPORTANT: I will only deal with the dyno functions, not with other measurement functions of the different systems).
First, there are different ways in which these systems measure:
- GPS signal
- G-sensor
- RPM and Km/h from the logs
My experiences were positive, but only if you wanted to have a wanted to have a "rough" direction of the power region... If one wanted to orientate torque curve, it became much more difficult or even impossible. difficult to impossible. All solutions had the problem, however, that measurements were difficult or impossible to reproduce. For private certainly a very nice gadget for private use, which is above all cheap, but not applicable for professional use. applicable.
But how does Insoric RealPower compare to the solutions mentioned above? solutions mentioned above?
By attaching the sensor to the wheel, the actual rotation is measured. is measured. As the wheel is measured before or directly after the measurement, the software knows exactly how much distance has been covered in how long. time.
It is also explained very well in this video:

Is it unique?
No, there are currently 2 comparable systems on the market that I know of. systems on the market:
On the one hand, Dynomet from Denmark, which Dynomet from Denmark () (http://www.dynomet.dk/en_portableroaddyno.htm), which I decided against because on the one hand the software does not have the functions functions that I would like to see in such a system, and secondly because the system is larger at the hub and a cable has to be laid in the interior. cable into the passenger compartment. The big fear was that in the worst case the sensor could the sensor would turn with the wheel and the cable would be dragged over the mudguard. the mudguard.
The other system is Dyno-Shaft from AEM (http://www.aemelectronics.com/files/pr/102811_Dyno-Shaft/Dyno-Shaft_PR.html), which can only be mounted from one vehicle to the next with great effort. from one vehicle to the next, because it has to be mounted directly on the must be mounted directly on the drive shaft.
How is the process of a measurement?
1.) The wheel is measured with the Insoric measuring tool
2.) The atmospheric pressure and temperature is measured with the Insoric barometer. Insoric barometer
3.) The sensor is glued to a wheel. (Insoric specifies here that it should be to be glued to a non-driven wheel in case of slippage. should have slip. Since this is less the case with all-wheel drive, you have a free choice. free choice here).
4.) On a flat road, acceleration is ideally in 3rd or 4th gear (higher gears are also possible). (higher gears are also possible). Depending on the engine Depending on the engine, the starting speed should not be too late. torque very early, therefore a measurement from 1500 rpm would make more sense. turbocharged engine, which is only juiced up from 4000 rpm. 4000 rpm.
5.) After acceleration, the gear is taken out (automatic gearbox in N or the highest gear) and the vehicle is rolled out and the vehicle is coasting until it has a difference of 30 km/h to the speed in the highest gear. Example: when measuring in 3rd gear. Example: when measuring in 3rd gear, the rev limiter is reached at 140 km/h. the vehicle will coast to at least 110 km/h.
6.) The data from the sensor are read out and the data wheel diameter, atmospheric pressure, temperature, weight are entered into the software and the software and the acceleration ranges are marked.
Here is also a video from Insoric that explains the process again:

Advantages
- No power limitation during measurement (as is the case with all roller test stands) the case with all roller test stands).
- the vehicle does not need to be lashed down
- real power loss is measured and therefore the power power indication on the wheel is very accurate. (Wheel power is clearly affected on (Wheel power is significantly affected on roller test stands due to strong lashing; measurements can be better compared with other measurements from other countries. countries where WHP is measured).
- correct temperature or airflow conditions, which are never (!) given on the dyno. are never (!) given on the dyno
- Less load for the engine
- Less tyre wear than on a roller test stand
- faster power measurement
Disadvantages
- The road must be dry or the corridor in which the test is carried out must be dry. grip have grip
- you need a straight test track
However, regardless of all the advantages, if the performance data and especially the torque curve do not correspond to reality, it is not possible to use it. the torque curve does not correspond to reality, you cannot work with it. work with it. Therefore, we started with the following tests to check whether Insoric delivers what it promises:
1. Test - performance measurement, are the measured performances correct?
Due to the time of year, there were not many vehicles were available that had been tuned and were therefore already on a roller test bench. a roller test stand, I also tested a few production cars here. that had very little mileage. Simply so that the factor wear/engine compression does not influence the measurement result.
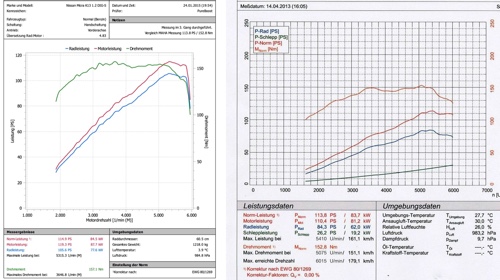
Nissan Micra 1.2 DIG-S
Measured at BHP on a MAHA LPS3000
Measurement result:
| Roller test stand | Insoric | |
| PS | 113,8 | 114,9 |
| Nm | 152,8 | 157,1 |
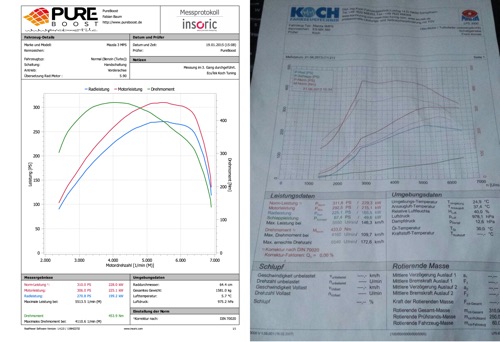
Mazda 3 MPS
Measured at Koch on a MAHA LPS3000, corrected according to DIN standard
Measurement result:
| Roller test stand | Insoric | |
| PS | 311,8 | 310,0 |
| Nm | 433,0 | 453,9 |
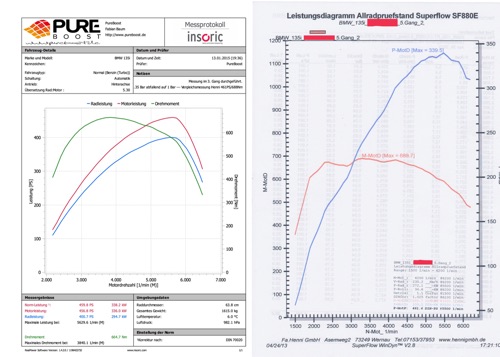
BMW 135i (boost pressure: 1.35 bar decreasing to 1 bar)
Measured at Henni on a SuperFlow AWD SF-880, corrected according to DIN Standard
Measurement result:
| Roller test stand | Insoric | |
| PS | 461,6 |
459,8 |
| Nm | 688,7 | 664,7 |
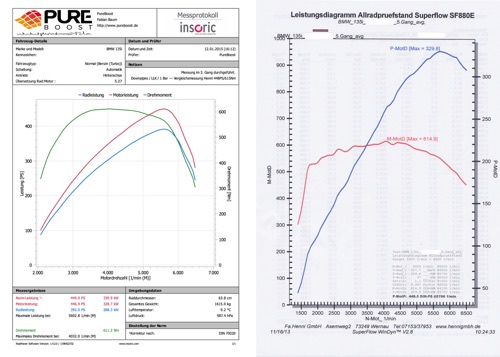
BMW 135i (boost pressure: 1 bar decreasing to 0.9 bar)
Measured at Henni on a SuperFlow AWD SF-880, corrected according to DIN Standard
Measurement result:
| Roller test stand | Insoric | |
| PS | 448,5 | 449,9 |
| Nm | 614,9 | 611,2 |
Subaru STI
No direct comparison! They are not the same vehicle but both had the same modifications and were tuned by me with similar setups. and were tuned by me with similar setups. The slight difference in torque comes from a slightly different mapping in the mid-range. Whereas in the upper rev range, where the horsepower was determined, the mapping is very similar. mapping is very similar.
Comparison:
| Vehicle1 (roller test stand) |
Vehicle 2 (Insoric) |
|
| PS | 325,0 | 323,4 |
| Nm | 440,6 | 422,5 |

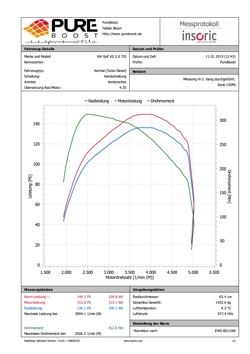
VW Golf VII 2.0 TDI
Insoric measurement compared with factory specifications.
Measurement result:
| Factory specification | Insoric | |
| PS | 150,0 | 149,3 |
| Nm | 320,0 | 312,6 |
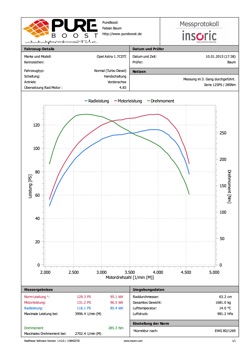
Opel Astra 1.7 CDTI
Insoric measurement compared with factory specifications.
Measurement result:
| Factory specification | Insoric | |
| PS | 125,0 | 129,3 |
| Nm | 280,0 | 285,3 |
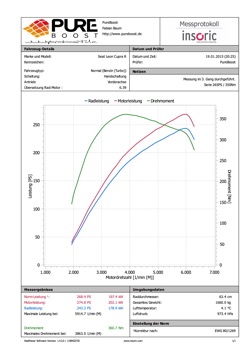
Seat Leon Cupra R
Insoric measurement compared with factory specifications.
Measurement result:
| Roller test stand | Insoric | |
| PS | 265,0 | 268,4 |
| Nm | 350,0 | 360,7 |
BMW 535d e61
Discreet performance increase or with a focus on ECO tuning, since the mileage is already over 200 tkm.
Expected power was between 300 and 320 hp with a targeted torque of a little over 600 Nm. torque of slightly more than 600 Nm.
Certainly, this measurement is not as meaningful as the others, because there are no comparative values. But nevertheless the roughly performance was achieved, hence a real measurement.
Measurement result:
| Insoric | |
| PS | 311,0 |
| Nm | 615,5 |

2. Test - Reproducibility of the measurements
Important For the use of Insoric during the tuning process is, of course, how much measurements differ from each other, when I take measurements with the same data set. This is the only way to to make sure that the added value of a change in the torque torque curve and that you can rely on it. In addition must also be said that even on a roller dynamometer, usually no no two results are exactly the same one after the other. A A certain fluctuation is therefore also normal in this environment. It is not only on roller test stands as well as with Insoric, the aim of a vote is to is to achieve an increase of a few hp. The extra power from The increase in performance due to a change must always be related to the changed values; e.g. 2� more aggresive ignition does not justify 5 hp, that would be only unnecessary load for the engine.
Here are the measured data of various measurements that were carried out one after the other. which were carried out one after the other:
Mazda 3 MPS:
| 1.Run | 291.1 HP |
425 Nm |
| 2.Run | 292,9
PS |
424 Nm |
| 3.Run |
293,2
PS |
429 Nm |
200sx s14a:
| 1.Run | 314.6 HP |
396.1 Nm |
| 2.Run | 316,2
PS |
396.7 Nm |
| 3.Run |
314,4
PS |
401.2 Nm |
Opel Astra 1.7 CDTI:
| 1.Run | 127.6 HP |
277.4 Nm |
| 2.Run | 129,2
PS |
285.5 Nm |
| 3.Run |
126,3
PS |
276.2 Nm |
| 4.Run |
126,3
PS |
287.1 Nm |
| 5.Run |
126,0
PS |
281.3 Nm |
Subaru STI:
| 1.Run | 318.3 HP |
412.3 Nm |
| 2.Run | 316,3
PS |
417.8 Nm |
| 3.Run |
316,3
PS |
416.3 Nm |
How it can be displayed in the software for comparison:
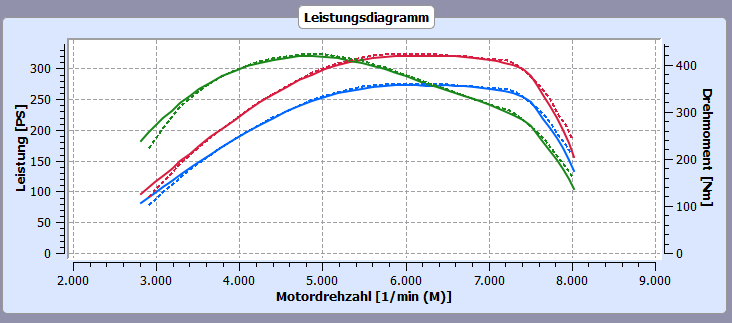
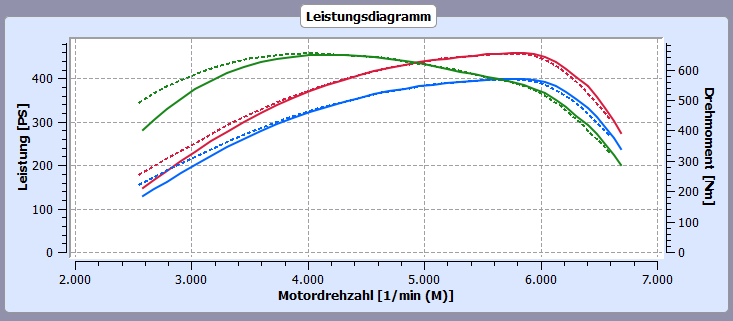
(measurement started at different speed)
3. Test - Torque curve and changes during tuning
Here is a test of how a change of 2� ignition can affect over the entire speed range at full throttle and is shown here. is shown:
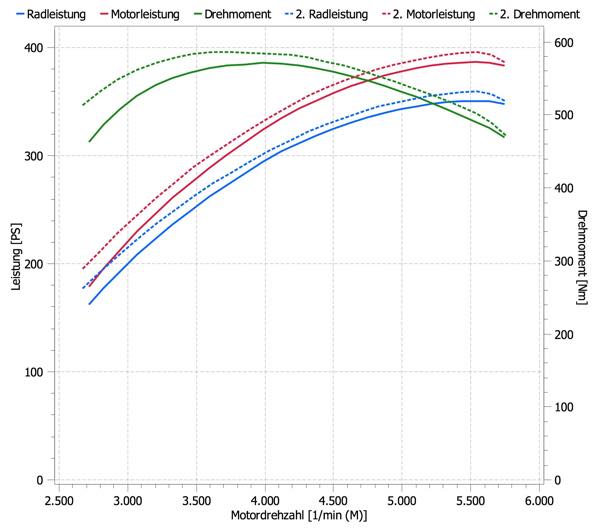
And a comparison of a greater change between HighBoost (boost pressure: 1.35 bar decreasing to 1 bar) and LowBoost (boost pressure: 1 bar down to 0.9 bar); ignition was of course adapted to the boost pressure pressure:

4. Test - Weight, how much does it influence the measurement result?
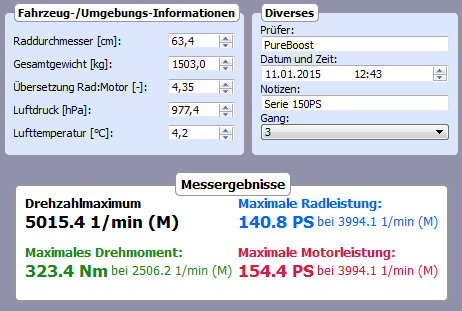
The biggest concern for me beforehand was the total weight and the impact. effect on the measurement. I have to admit that I was surprised at how little a change in weight how little a change in weight affects the measurement result. I I think the worries came more from the other measurement methods with G-sensor and GPS sensor, as I always had the impression that a couple of kg made a big difference. Here's a rough indication of how a different weight weight has on the measurement:

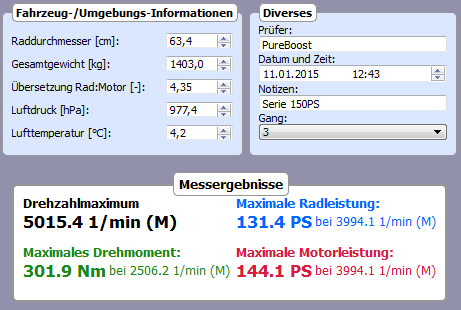
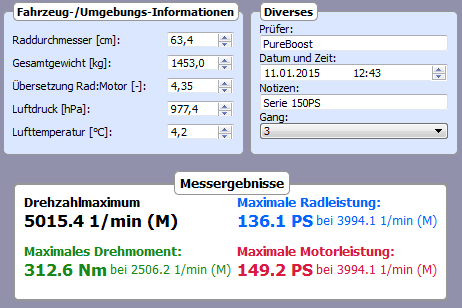
But where do you get the weight for the measurement?
For vehicles that do not have an extreme hi-fi upgrade or, as is often the case, are empty, Insoric says you can trust the data in the registration book. This was also confirmed by my tests. The weight in the vehicle registration is standardised according to DIN70020 and means Unladen weight of the vehicle with 90% tank capacity and 75 kg driver. These These weights must of course be taken into account when entering the data, so that one does not the unladen weight + passengers. Extremely modified (significantly heavier or lighter) vehicles should be be measured beforehand in order to be able to measure the power as accurately as possible. I am still looking for a "mobile" solution.
Nevertheless, the weight does not have such a strong effect and it has no influence at all on the functioning of a vote. and it has no influence at all on the functioning of a tuning. the torque lines are only given a minimally different scale, but still but still the real course.
Conclusion:
Insoric combines the advantages of the street (real the advantages of the street (real conditions) and the advantages of a role play (check what has brought about a change; where do you stand on the road? you are at the the torque curve) without forgetting the disadvantages that both The result of the test is that the user has to work with the disadvantages that both solutions have had so far, that both solutions have had so far. It turned out that the measurement results very reproducible and can easily compete with a roller test rig. can easily compete with a roller test stand. Even several measurements in a row provide the same result as on the roller test stand.
Measuring/tuning with Insoric will therefore also become a new part of of PureBoost. Reconciliations on reel stands are, of course, still still possible on request.